Appendices
Appendix A: Evidence log
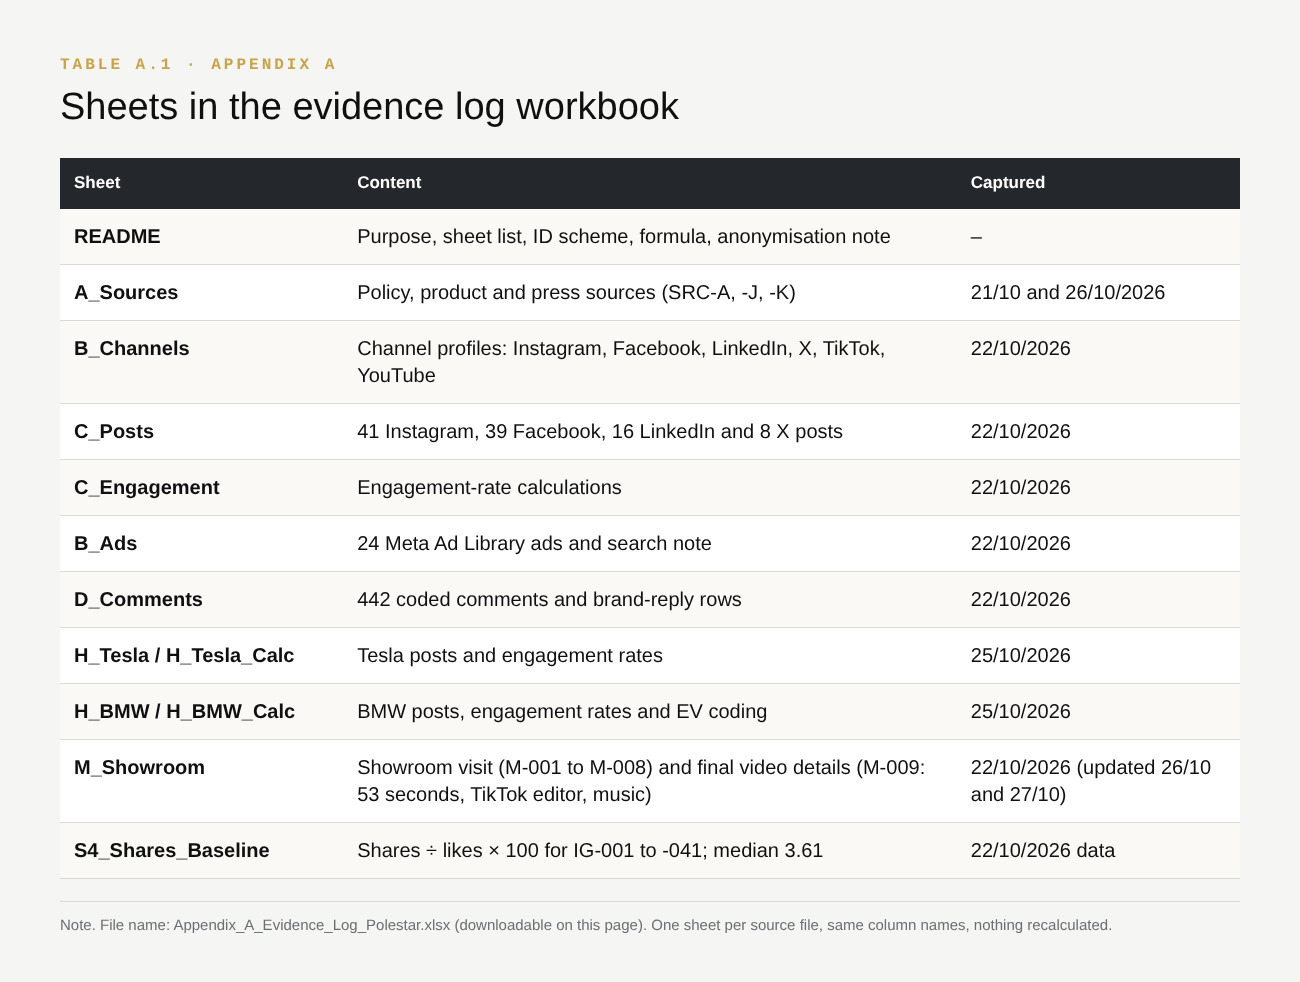
Appendix A is the full evidence log, downloadable from the portfolio website. It holds every Polestar, Tesla and BMW figure used in the text, with ID, capture date and time, URL, value exactly as shown, screenshot file and limitation. Commenters are anonymised. Engagement rates are recalculated only from logged values (Appendix C).
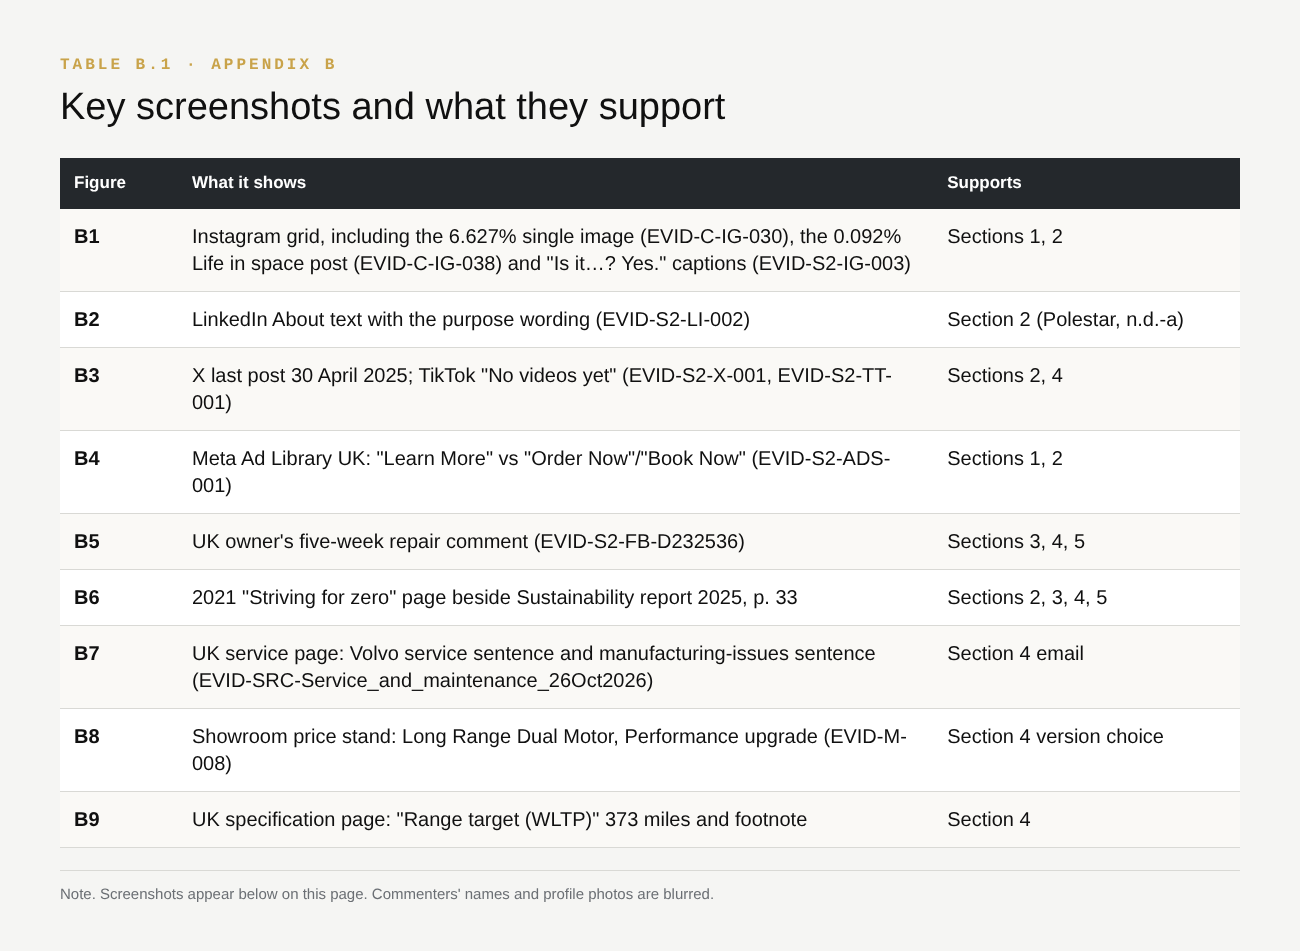
Appendix B: Key screenshots
Appendix C: Method notes
C1. Sampling and capture dates. I captured Polestar’s public global channels on 22 October 2026 between 20:44 and 23:35 UK time, using native platform pages. On Instagram I logged 41 posts dated 11 August to 22 October 2026 (72 days), and on Facebook 39 posts dated 12 August to 22 October (71 days). These cover most, but not all, of a 90-day window. LinkedIn showed only relative dates, so its 16 posts cover about one month. X was logged back to its last visible post on 30 April 2025, and TikTok showed no videos. I captured Tesla (@teslamotors) and BMW (@bmw) on 25 October 2026. Tesla’s sample covers 20 posts excluding pinned posts and includes its Roadster reveal. BMW’s 35 posts come from two six-day spans with a gap from 11 to 19 October. Paid activity comes from the Meta Ad Library (country United Kingdom, keyword “Polestar”, 22 October 2026, 23:35), where 24 Polestar ads were visible. Policy and product sources were logged on 21 and 26 October 2026. The showroom visit was on 22 October 2026, with a staff member’s verbal permission to film.
C2. Engagement rate. For each post: engagement rate = (likes + comments) ÷ followers × 100. I used values exactly as displayed, so “K” figures carry the platform’s rounding, and I report the median across posts, excluding pinned posts. Shares and reach are not part of the formula because most platforms do not show reach publicly. The Section 4 baseline uses shares ÷ likes × 100 per Instagram post (n = 41; median 3.61, range 0.52 to 12.87). Follower bases differ about fiftyfold between Polestar and BMW, so I treat cross-brand engagement rates as indicative.
C3. Sentiment coding. I coded 442 public comments (Instagram 331, YouTube 82, Facebook 29) into five categories: positive, negative, mixed, question or request, and neutral or off-topic. Positive share = positive ÷ (positive + negative + mixed), so questions and off-topic comments do not dilute it. Brand replies were excluded. One Instagram row groups nine near-empty spam comments. Comments follow each platform’s default ranking (YouTube “Top”, Instagram’s own order, Facebook “Most relevant”), not random selection. Commenters are replaced by codes (U01, I001, F01). The 60% comparison point is a module aggregate from W3_ACTIVITY_KPI_Benchmarks, not an industry standard.
C4. Limitations. Reach, impressions, click-through and conversion data are not public for any brand, so I set no numerical KPI targets. Samples are short and partly event-driven (Tesla’s Roadster reveal, Polestar 4 SUV launch). Emoji-only comments lift Instagram’s positive share, and Facebook’s 29 comments are too few to generalise. One owner appears on both Instagram and Facebook. The staff remark about range is one informal, unrecorded comment. Platform figures can change after capture, which is why every value carries its capture time.
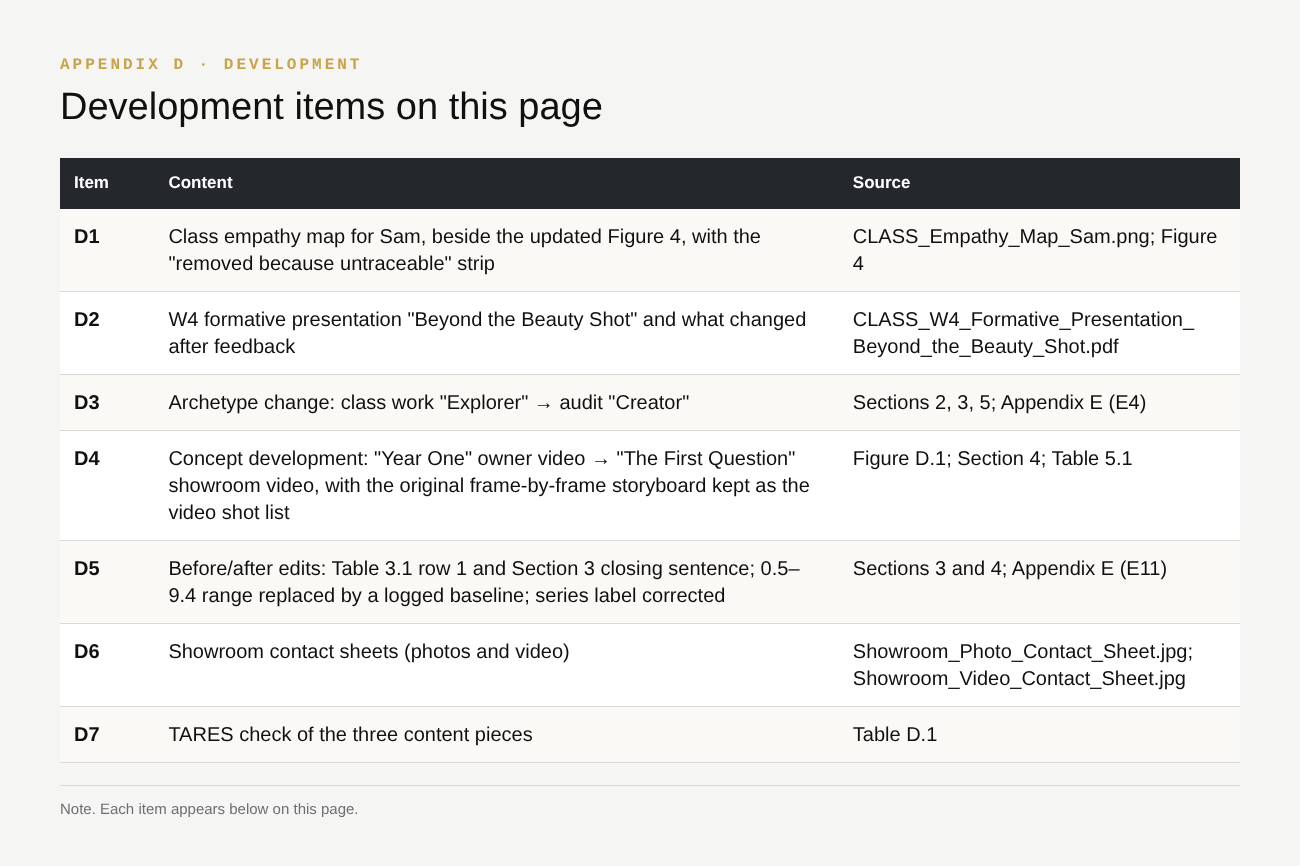
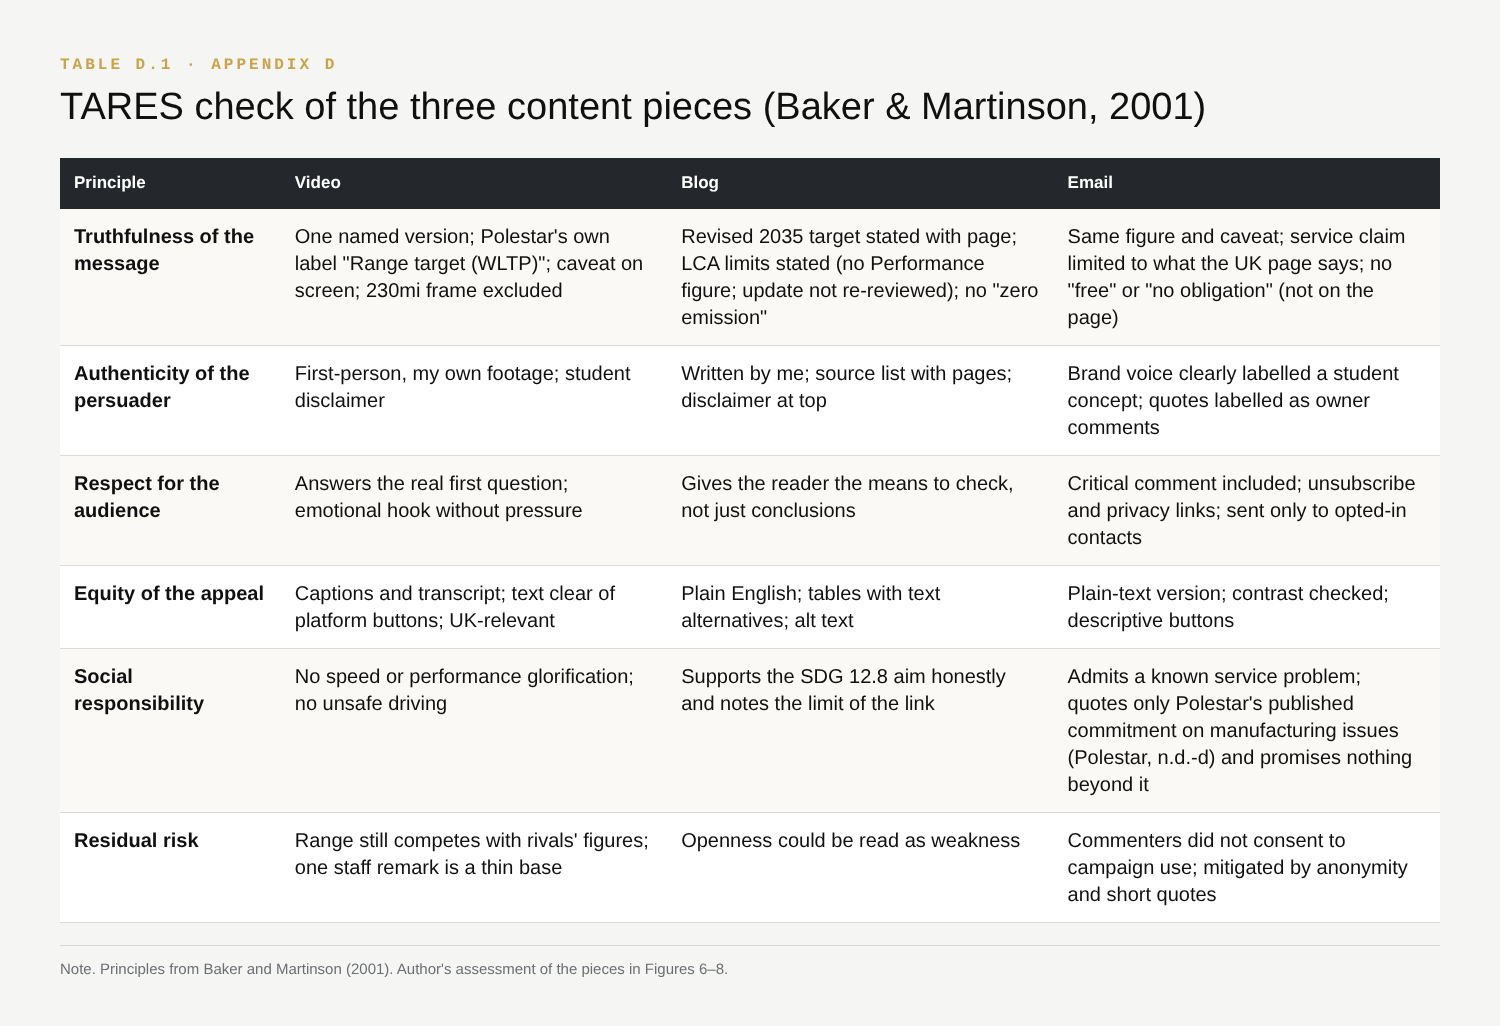
Appendix D: Evidence of development